![[attach.png]](idldoc-resources/attach.png)
./
pp_resample.pro
Author information
- Author
Paulo Penteado (pp.penteado@gmail.com), Feb/2010
Routines
pp_resample_test [, nr]Examples to test and illustrate the different behaviors of pp_resample.
result = pp_resample(y, x, xout [, xstart=xstart] [, xend=xend] [, xbox=xbox] [, ybox=ybox] [, xoutbox=xoutbox] [, youtbox=youtbox] [, local=local] [, newton=newton], p0=p0 [, lsquadratic=lsquadratic] [, quadratic=quadratic] [, spline=spline])Resamples the given y(x) function, preserving its area (not just a simple interpolation of the function points, as interpol would do).
Routine details
toppp_resample_test
pp_resample_test [, nr]
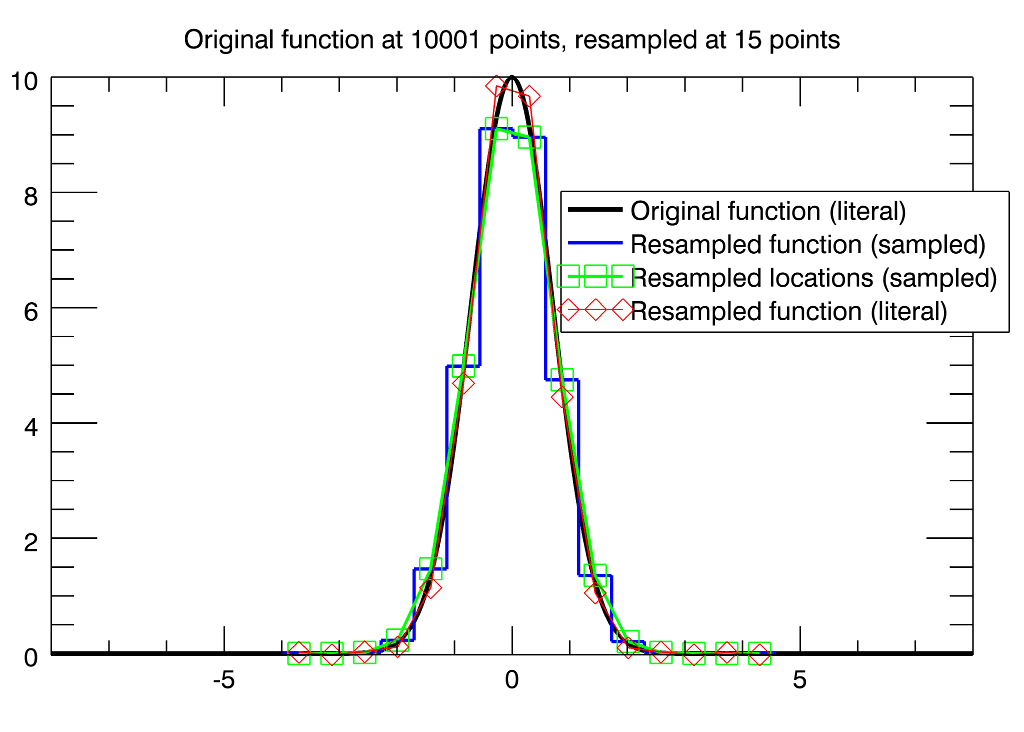
Examples to test and illustrate the different behaviors of pp_resample.
Makes up a high resolution Gaussian line and resamples at nr locations (defaults to 15).
Parameters
- nr in optional default=15
The number of locations where the function is to be resampled at.
Examples
Run the pp_resample_test routine, to compare the different methods, at different resampling resolution:
.com pp_resample ;pp_resample_test is in pp_resample.pro, so it will not be found by itself
pp_resample_test,15 ;At this resolution, the local mode is still reasonable.
sigma: 7.6632088e-09 6.6129373e-11 1.1358731e-13
Trapezoidal areas
New grid Original areas Resampled areas
-3.700000E+00 0.000000E+00 0.000000E+00
-3.128571E+00 8.421810E-05 8.421810E-05
-2.557143E+00 2.646517E-03 2.731632E-03
-1.985714E+00 4.414658E-02 4.425478E-02
-1.414286E+00 4.031373E-01 4.035549E-01
-8.428571E-01 2.067294E+00 2.069880E+00
-2.714286E-01 6.213192E+00 6.223648E+00
3.000000E-01 1.177465E+01 1.179997E+01
8.714286E-01 1.579429E+01 1.583423E+01
1.442857E+00 1.735853E+01 1.740596E+01
2.014286E+00 1.768562E+01 1.773506E+01
2.585714E+00 1.772227E+01 1.777198E+01
3.157143E+00 1.772447E+01 1.777420E+01
3.728571E+00 1.772454E+01 1.777427E+01
4.300000E+00 1.772454E+01 1.777427E+01
Rectangular areas
Start End Original areas Resampled areas
-3.985714E+00 -3.414286E+00 1.217446E-05 1.217446E-05
-3.414286E+00 -2.842857E+00 5.196621E-04 1.176678E-02
-2.842857E+00 -2.271429E+00 1.176170E-02 1.446414E-01
-2.271429E+00 -1.700000E+00 1.445446E-01 9.845714E-01
-1.700000E+00 -1.128571E+00 9.835830E-01 3.834577E+00
-1.128571E+00 -5.571429E-01 3.829106E+00 9.038319E+00
-5.571429E-01 1.428571E-02 9.021113E+00 1.415784E+01
1.428571E-02 5.857143E-01 1.412464E+01 1.687159E+01
5.857143E-01 1.157143E+00 1.682703E+01 1.764558E+01
1.157143E+00 1.728571E+00 1.759682E+01 1.776405E+01
1.728571E+00 2.300000E+00 1.771449E+01 1.777375E+01
2.300000E+00 2.871429E+00 1.772411E+01 1.777418E+01
2.871429E+00 3.442857E+00 1.772453E+01 1.777419E+01
3.442857E+00 4.014286E+00 1.772454E+01 1.777419E+01
4.014286E+00 4.585714E+00 1.772454E+01 1.777419E+01
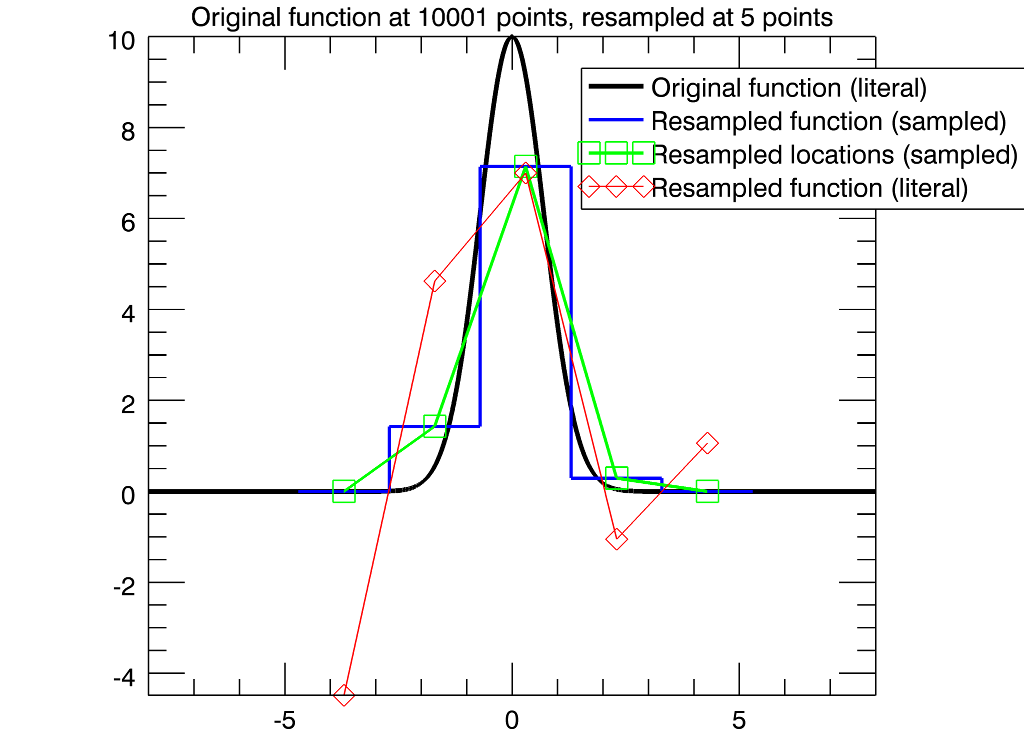
pp_resample_test,5 ;At this resolution, the local mode gives an ugly result, but non local is still good.
sigma: 7.7028521e-09 6.6471473e-11 1.1417492e-13
Trapezoidal areas
New grid Original areas Resampled areas
-3.700000E+00 0.000000E+00 -0.000000E+00
-1.700000E+00 1.436523E-01 1.436523E-01
3.000000E-01 1.177465E+01 1.191919E+01
2.300000E+00 1.771441E+01 1.787357E+01
4.300000E+00 1.772454E+01 1.788378E+01
Rectangular areas
Start End Original areas Resampled areas
-4.700000E+00 -2.700000E+00 1.201453E-03 1.201453E-03
-2.700000E+00 -7.000000E-01 2.865225E+00 1.715248E+01
-7.000000E-01 1.300000E+00 1.714266E+01 1.773729E+01
1.300000E+00 3.300000E+00 1.772451E+01 1.773732E+01
3.300000E+00 5.300000E+00 1.772454E+01 1.773735E+01
Author information
- Author:
Paulo Penteado (pp.penteado@gmail.com), Feb/2010
Other attributes
- Uses:
toppp_resample
result = pp_resample(y, x, xout [, xstart=xstart] [, xend=xend] [, xbox=xbox] [, ybox=ybox] [, xoutbox=xoutbox] [, youtbox=youtbox] [, local=local] [, newton=newton], p0=p0 [, lsquadratic=lsquadratic] [, quadratic=quadratic] [, spline=spline])
Resamples the given y(x) function, preserving its area (not just a simple interpolation of the function points, as interpol would do). By default (local=0), each input y(x) is interpreted a measured sample, that is, as the average of the "flux" falling inside the region centered at the corresponding x value: x locations are interpreted as the centers of bins. The same interpretation is used for the output locations (xout), and the returned results. See the plots in the example for a graphical demonstration.
A literal interpretation of the function (setting the keyword local), as pp_integral does, is intended, but not yet properly implemented, so the local mode should not be used at this time. The input values must be ordered in x (it does not matter whether it is increasing or decreasing order).
Return value
An array with the same length as xout, with the input function resampled at those locations.
Parameters
- y in required
An array with the function values corresponding to the locations in x.
- x in required
An array of locations where the function is sampled. Must be ordered (increasing or decreasing).
- xout in required
An array of the locations where the y(x) function is to be resampled.
Keywords
- xstart out optional
Used when not in local mode, to return the start locations of the bins with center in xout.
- xend out optional
Used when not in local mode, to return the end locations of the bins with center in xout.
- xbox out optional
Used when not in local mode, to return the input x values in pairs of equal values, so that plotting xbox,ybox shows the rectangles that are how the input values were interpreted.
- ybox out optional
Used when not in local mode, to return the input y values in pairs of equal values, so that plotting xbox,ybox shows the rectangles that are how the input values were interpreted.
- xoutbox out optional
Used when not in local mode, to return the resampled x values in pairs of equal values, so that plotting xoutbox,youtbox shows the rectangles that are how the resampled values are to be interpreted.
- youtbox out optional
Used when not in local mode, to return the resampled y values in pairs of equal values, so that plotting xoutbox,youtbox shows the rectangles that are how the resampled values are to be interpreted.
- local in optional default=0
If not set, the y values are interpreted as a measured sample, that is, as the average of the "flux" falling inside the region centered at the corresponding x values: x locations are interpreted as the centers of bins. Since this interpretation is equivalent to a literal interpretation of a function made of rectangular regions, in this method there are no interpolations (partial areas, if any, are just the corresponding fractions of the rectangles). The returned values are to be interpreted in the same way, that is, they represent rectangular bins, which have the same area as the rectangular bins in the corresponding region of the input function.
If set, interprets the function literally. The result is a function where the area between each of its points (at xout) is the same as the area of y(x) between these locations.
- newton in optional default=0
Passed on to pp_integral. If local is set and newton is set, the function integrations are done with int_tabulated, which uses a 5 point Newton-Cotes formula. If local is not set, this has no effect.
- p0 in default=4
Parameter for the local mode. It should not be necessary to change it from the default, and it should disappear in future implementations. It is the number of points to use for the numeric evaluation of a function's minimum, but the result is not expected to vary for p0 larger than 3, as the function is expected to be an exact parabola.
- lsquadratic in optional default=0
Passed on to pp_integral. If the method requires interpolation, this is passed on to interpol, to select 4 point quadratic interpolation. If none of lsquadratic, quadratic and spline are set, interpolation is linear.
- quadratic in optional default=0
Passed on to pp_integral. If the method requires interpolation, this is passed on to interpol, to select 3 point quadratic interpolation. If none of lsquadratic, quadratic and spline are set, interpolation is linear.
- spline in optional default=0
Passed on to pp_integral. If the method requires interpolation, this is passed on to interpol, to select spline interpolation. If none of lsquadratic, quadratic and spline are set, interpolation is linear.
Examples
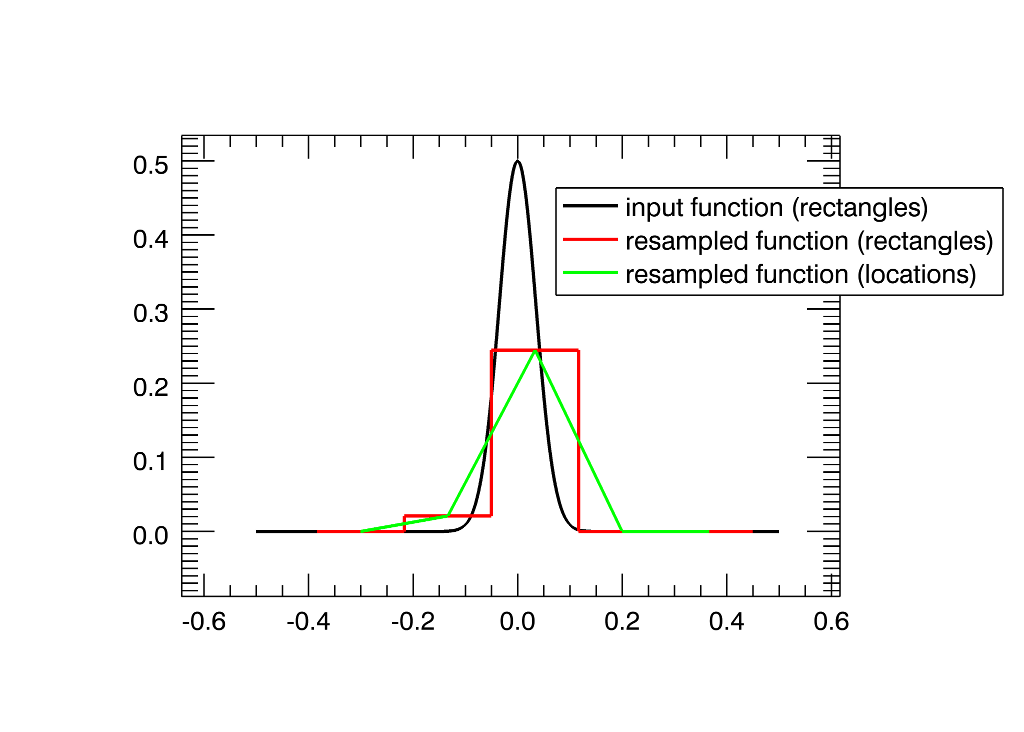
Make a well-sampled input function y(x) and an output grid xout with few locations:
 x=dindgen(10001)/1d4-0.5d0
 y=exp(-(x*2d1)^2)*0.5d0
 xout=dindgen(5)/6d0-0.3d0
Do the resampling and look at the results:
 yout=pp_resample(y,x,xout,xstart=xstart,xend=xend,xbox=xbox,ybox=ybox,xoutbox=xoutbox,youtbox=youtbox)
 print,xstart,xend
 ;-0.38333333     -0.21666667    -0.050000000      0.11666667      0.28333333
 ;-0.21666667    -0.050000000      0.11666667      0.28333333      0.45000000
 print,xstart,xend
 ;-0.38333333     -0.21666667    -0.050000000      0.11666667      0.28333333
 ;-0.21666667    -0.050000000      0.11666667      0.28333333      0.45000000
 iplot,xbox,ybox,name='input function (rectangles)',/insert_legend,thick=2.
 iplot,xoutbox,youtbox,/over,color=[255,0,0],name='resampled function (rectangles)',/insert_legend,thick=2.
 iplot,xout,yout,/over,color=[0,255,0],name='resampled function (locations)',/insert_legend,thick=2.
See also the example in pp_resample_test, for a comparison of the methods.
Author information
- Author:
Paulo Penteado (pp.penteado@gmail.com), Feb/2010
Other attributes
- Todo:
Improve the implementation of the resampling when local is set, to get replace the numerical minimization by an analytic expression.
- Uses:
File attributes
| Modification date: | Sat May 29 22:35:14 2010 |
| Lines: | 281 |
| Docformat: | rst rst |